
All Sinners Take Care
“I can solve a basic trig equation” The lesson aim that seems to strike fear into the heart of any young mathematician. Could I use a visual tool to remove this fear?
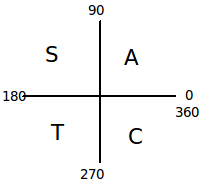
I remember learning this as a pupil and being introduced to the Quadrant Diagram. Where did it come from? I was told a mnemonic to help me recall it: All Sinners Take Care. And I was shown a process for how to use it. It took me to Higher maths before I realised where it came from! I didn’t want that for my students
To introduce the topic I had students use Desmos to graph a trig function and a horizonal line and write down the first 2 solutions. They seemed ok with this.
In groups they wrote down reasons why there were multiple solutions and I asked them to hypothesise how they could find the next solution if they knew the first. I gave each group a basic trig equation and asked them to find the first two solutions.
e.g. Solve 

Getting the first answer seemed alright for students – a lot of them connected it to finding the angle in a right-angled triangle. But how to find the next answer?
Looking at the graph for help was easy since Desmos drew it. I asked the students what they could do if they didn’t have Desmos? ‘Draw it’ seemed a popular idea so I had them do that… I found the answer before they’d finished. “But how did you do that so quick?” a student shouted out.
We went back to our basic graphs of trig functions to see where all the positive values are. Students noticed that there seemed to be distinct areas where each function was positive. I was chuffed they’d spotted it without much direction so I moved them on to telling me the limits for each section. I placed these into Desmos on the smartboard for us all to see. (click the graph to see)


From here students developed the idea of either adding or subtracting the calculator answer to the limits. I shared with them the Quadrant Diagram as a way to quickly summarise their findings.
Using Desmos was a great way to visually show what the students had told me. They were confident with the graphs of trig functions, and it only needed a quick explanation of how to write out the limits the students came up with for the sections. It was much quicker than previous lessons where I’d have students make tables of sin, cos and tan and evaluate for different variables…eventually leading to the point where hopefully someone would spot a pattern in all that data. Desmos allowed students to visualise what was happening and build their understanding around that.
Next week we’re onto more complex trig equations: 
Factorising trinomials foldable. Really helping Ss understand the difference between each type. #teach180 pic.twitter.com/SkxzIE50EX
— Julie Morgan (@fractionfanatic) August 24, 2015

Recent Comments